Embedding Maps from ArcGIS Online
Three examples of embedding maps that were created using ArcGIS online follow. The features of the first two embedded maps were created using ArcGIS online functionality.
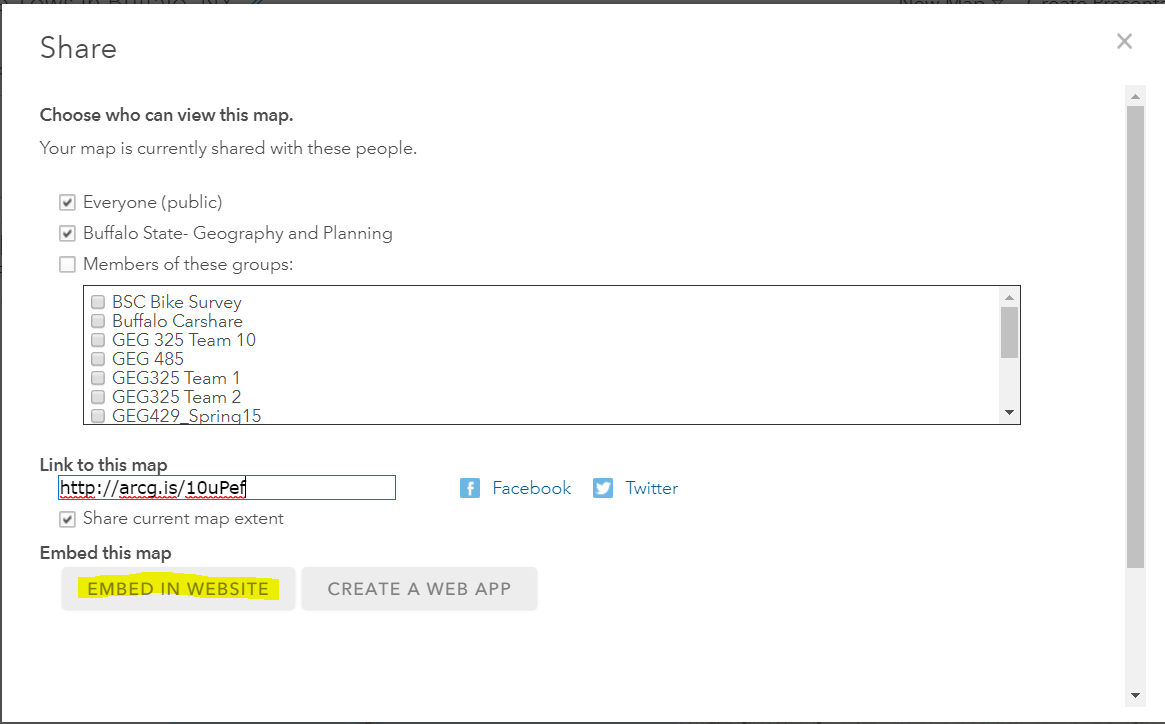
In the map view, the SHARE button provides an option to EMBED a map. If this option is selected, a new window with the map URL appears along with check boxes to include additional functions. For the first two maps
- the Home Button option,
- the Map Details (panel) option,
- the Legend (panel) with layers toggle option
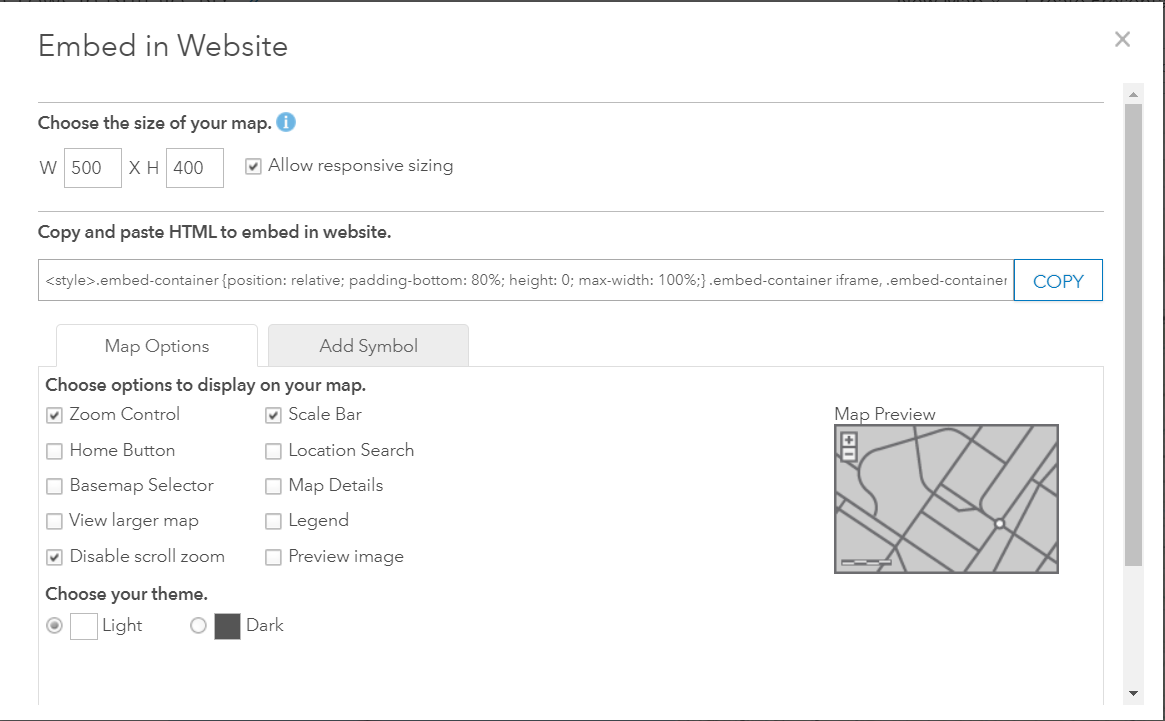
were checked and the default panel set to legend in the first map and details in the second map. The >> button (top-left corner) allows users to open and close these panels. ArcGIS online automatically incorporates selected options into the map URL, so you only have to click the COPY button after you have made your selections.
Once the URL is pasted in this html file, the style parameters were copied to a separate css file (linked to this html). Whenever embedding an ArcGIS Online map you must change the beginning of the source (src) tag to src="https://arcgis.com/..." The only other changes made to the first two maps on this page are adding "&level=11" and changing frameborder, marginheight and marginwidth to 2.
An example of embedding a map is HERE
This first heat map shows areas in Buffalo, NY where a lot of vehicle tows occured between Jan and Mar, 2019. With respect to making these maps, topics to review include:
- Importing point data from open sources
- Symbolizing point layers
- heatmaps
- Customizing pop-ups
- Arcade functions
- working with datetime variables
- Arcade functions
BACK TO TOP
This second map contains two heat map layers showing concentrations of calls for pothole repair service in Buffalo, NY. The map making topics for the first map apply here. However, arcade functions are used to convert the datetime variable to month and day as well as calculate the diffference between closed date and open date in days to provide a response time estimate. The Details panel contains information about the motivation behind these maps and links to the data sources. This map and the third map were created in response to recent articles in TV and print media!
BACK TO TOP
Assignment: High End Homes Mapping Application
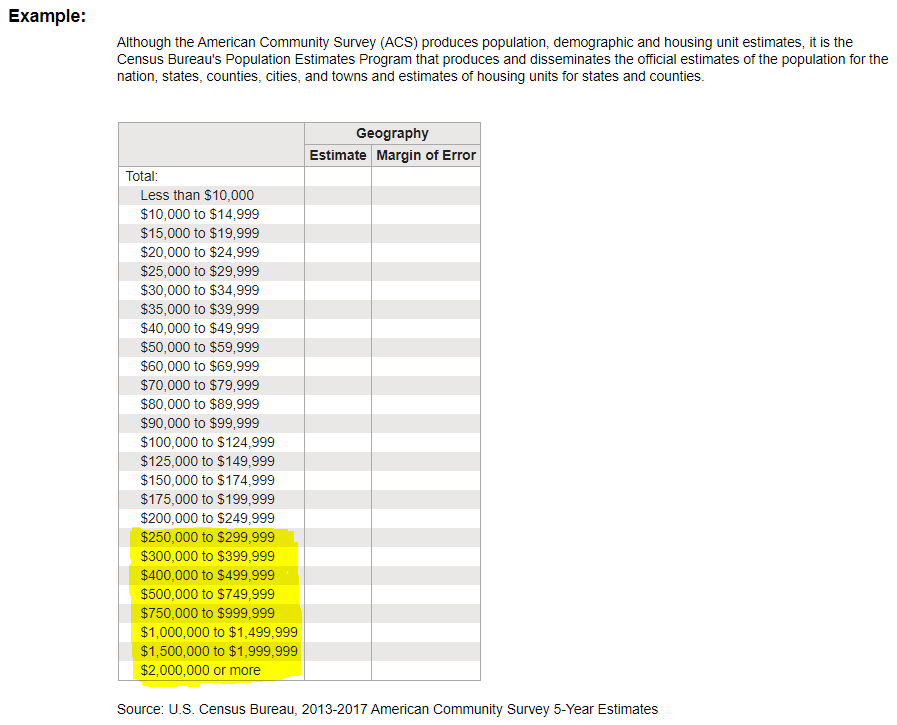
A recent article, “Most of the homes in three local ZIPs are worth more than $250,000; check out the full rundown of WNY’s high-end housing” in Bizjournals By G. Scott Thomas (Projects Editor, Buffalo Business First, Jan 28, 2019, 9:09am EST) needs a map.
Data Needs (from article):
- Base geography and constraints: "by zip code in western New York that contain a minimum of 1,000 owner occupied homes.
- Study Area: “Western New York includes Allegany, Cattaraugus, Chautauqua, Erie, Genesee, Niagara, Orleans and Wyoming counties.”
- Data elements: Total Owner occupied homes (count) within each zip code, and Total OOH Valued at $250,000 or higher (count) within each zip code. From these counts, the share of OOH (percentage or proportion) at $250,000 or higher within each zip code is calculated using Arcade expressions.
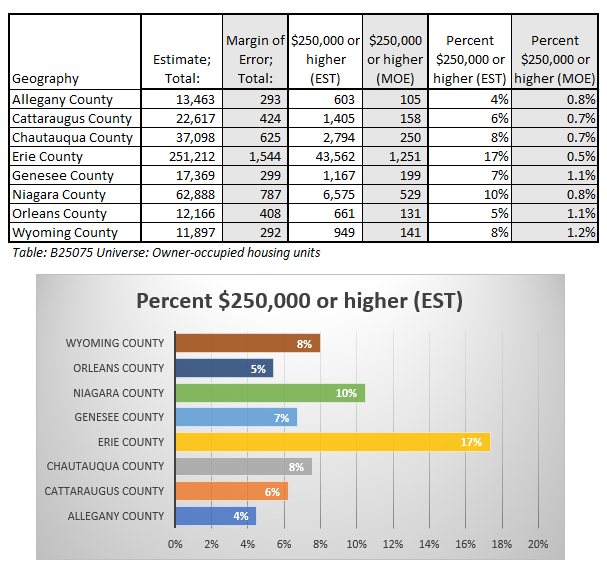
This exercise uses ESRI ArcGIS online to create a map. Data are from the 2018 American Community Suvery (ACS) 5 yr. estimates. The map includes county (shoreline) boundaries as a reference layer for the zip code polygons. This layer is added from the NYS GIS Clearinghouse REST services. The counties are filtered to show boundaries in New York State only.
In this example, several additional URL parameters are incorporated in the default embed statement to change the appearance and functionality of the application. Most notable are forcing the pop-up information to appear in the side (INFO) panel and the addition of a search tool for zip codes.
BACK TO TOP